
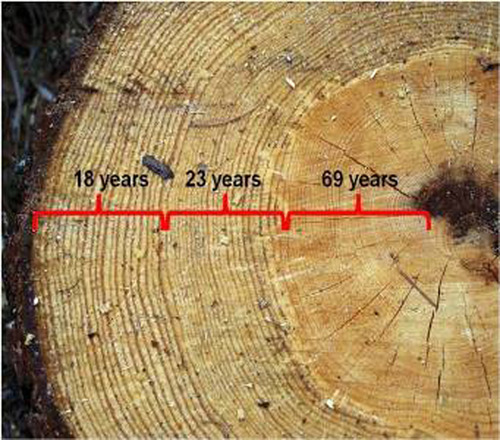
Can the growth history of a tree tell us whether a tree is a Big Grove survivor?
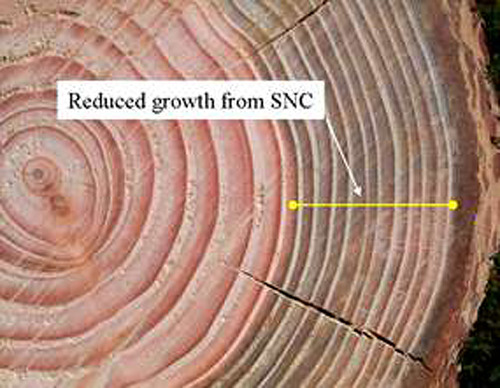
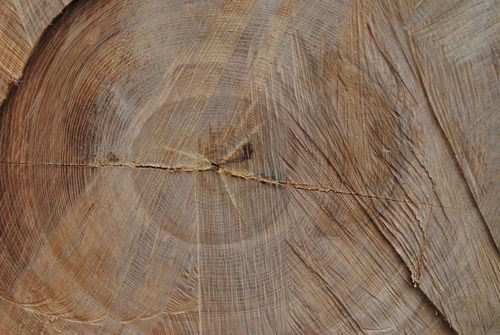
There is much more to dendrochronology than just counting rings and determining age. For example, the tree below grew narrower rings after becoming infected with a fungus.
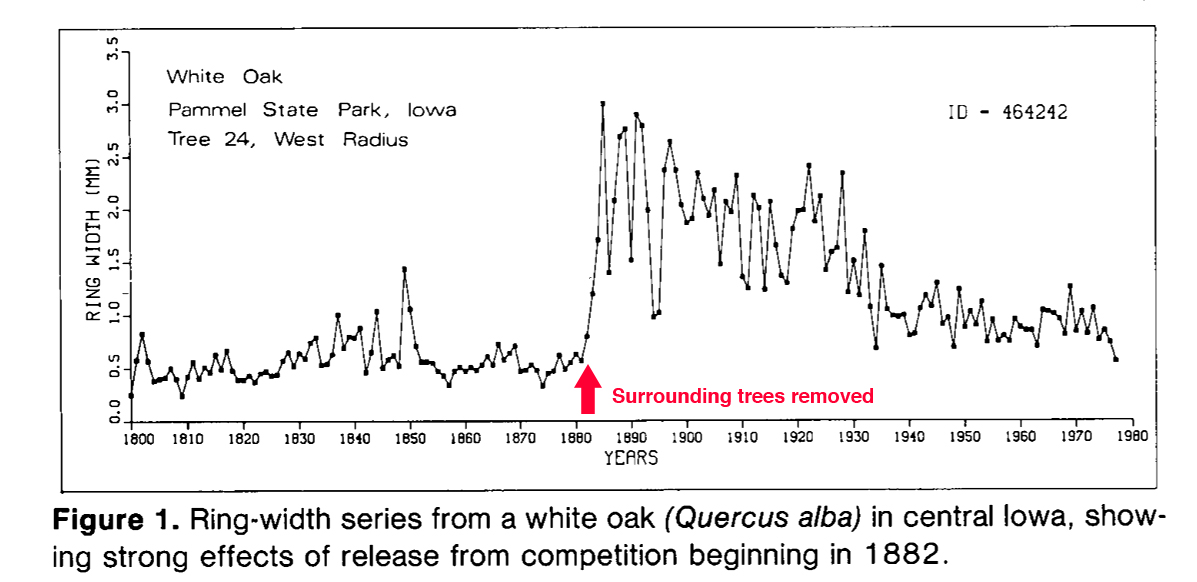
The rings of the tree below, on the other hand, increased greatly after surrounding trees were cut, leaving it with more room to grow. Patterns of increased and decreased ring width can thus be used to tell us about what happened to a tree − or the place where the tree grew − in the past.
These types of events in the life of a tree are especially clear when the ring widths are graphed against tree age (from the ring count). The example below (Blasing and Puvik 1983) shows that cutting of surrounding trees caused a large "jump" in ring widths in an oak that suddenly had no competitors.
Other types of events, like rainfall or temperature, affect all the trees in a region in the same way. For example, the graph below shows the relationship between ring widths and yearly rainfall in the "Crystal Lake Ash", and the other two trees also show the same relationship (Background).
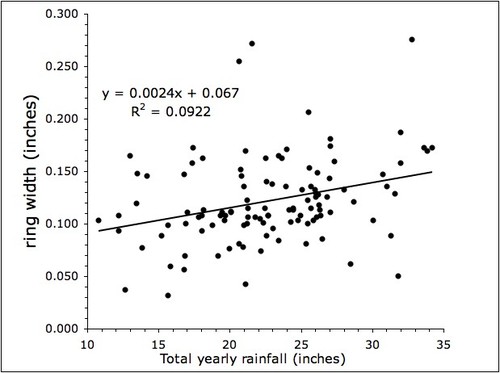
As can be seen, though, the effect of rainfall on ring widths is small - there is a lot of "scatter" around the trend line. This makes perfect sense, however, when one realizes that rainfall is just one of the many things that affect ring widths — species of tree, temperature, soil nutrients, competition with neighboring trees, disease, soil type, and other factors all affect the amount of growth each year. To isolated the effect of, for example, rainfall, tree researchers first statistically remove factors that affect each tree individually — competition, local soil type, etc. — and then average across many trees of the same species to measure for the true effect of regional factors like rainfall. Then, and only then, can you do things like deduce rainfall accurately for years before there was a written weather record.
The data below have been treated this way (which is why the y-axis is labeled "Tree-ring Index" rather than just ring width). The data are for Torrey Pines on the California Island of Santa Rosa (Williams 2013; Biondi et al. 1997). The fit of the data is much closer to the trendline than for the Crystal Lake Ash, and the data are in this case good enough to infer yearly rainfall totals for past years with reasonable accuracy.

We would need ring widths from fifty or more trees in the Crystal Lake area to even begin to tell us anything reliable about past Champaign County climate, but just for fun I have taken a shot at standardizing widths for the three trees, and graphing them against annual rainfall for years that weather records are available (Background).
Parks, protected areas, and "salvage dendrochronology"
Obviously one can't just walk into a park and start cutting down trees (or even drilling cores, which may admit disease into the tree). One way to obtain data from parks and other protected areas is to count rings in trees that fall naturally (in storms, for example) or are cut down by park officials for various reasons. For example, a diseased tree with large dead branches hanging over a heavily used bike and hike trail is a hazard to human health and must be cut down. Obtaining data from trees cut for such reasons has been called "salvage dendrochronology", and has the advantage of capturing data that would otherwise be unavailable, but the disadvantage of limiting data. All three trees measured here are the result of a salvage operation. The Crystal Lake Ash was a healthy tree growing in a heavily trafficked area that was almost inevitably going to die in the next few years from Emerald Ash Borer, a beetle from Asia that is killing millions of ashes in the eastern United States. The Entrance White Oak was a hollow, structurally weak tree that blew over in a storm. The Track Bur Oak had apparently become diseased, with many large dead branches, and was growing in the very middle of an area where hundreds of fairgoers walk every summer. For all three, I photographed the cut stumps, and in one case (the white oak) was able to take a small section of the cut trunk. Details of each tree are given in Background.
Three levels of ring-width accuracy in my data
Each of the three trees was studied at a different level of accuracy, depending on the time for which the stump was available. The first of these levels is available to anyone with a digital camera (or decent cell phone camera) and a ruler or tape measure.
Level 1 (low resolution): Photograph the rings on the cut log with a couple of snapshots, measure the stump diameter, and then count and measure rings in a good print (enlarged), or using Photoshop or other image software.
This is what I did for the Crystal Lake Ash (Background), the first tree I studied. I was in the park in mid-March, 2012 with my camera (and a tape measure I always carry in my camera bag), and I noticed that the ash had been cut down. Below is one of the three photos I took showing the sawn surface:
When enlarged, but number of rings in this photo are easily counted. And after some editing and rescaling (because the hand-held photos were not taken from exactly the same distance from the cut), I ended up with 3 cropped photos in which rings could not only be counted, but also roughly measured (Background). This is a section of one of these edited a bit further for this web site:
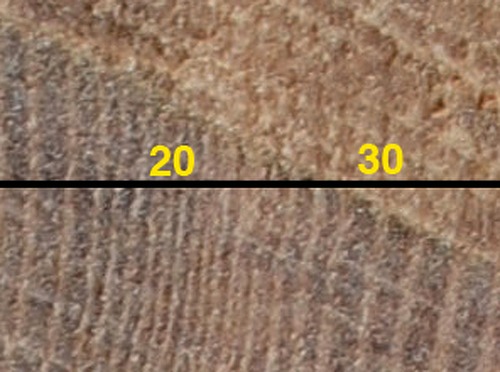
Despite the low resolution (each pixel in the original photos was about 0.09 mm, or 12 pixels per mm), the rings are countable and differences in ring width are quite visible (note the narrow bands at the 20 ring mark, and the larger ones at the 30 ring mark). Ring widths are measured from center of one thin light line (spring wood, see next section) to the center of the next line. The ash photos show that, despite the limitations of the low resolution, much can be learned from a simple snapshot. The tree and stump were gone a few days later, so I was glad I had taken advantage of chance opportunity.
Level 2 (intermediate resolution): Photograph the rings at close distance on the stump using a copy stand, including a ruler in each photo, and then count and measure rings using Photoshop or other image software.
The Track Bur Oak (data in Background) demonstrates this level of resolution. I used a Nikon SLR camera with a general purpose 18-55mm f/3.5-5.6 zoom lens at the closest distance at which it would focus, with the camera in a copy stand to ensure that each photo was taken at the same distance from the wood surface. Most of the large stump was not sanded smooth, and the rings were photographed just as they appeared on the weathered stump. A mm ruler was taped from center to edge and photos were taken along this guide. One pixel measured 0.017 mm, which corresponded to 59.1 pixels per mm. This is a representative photo:
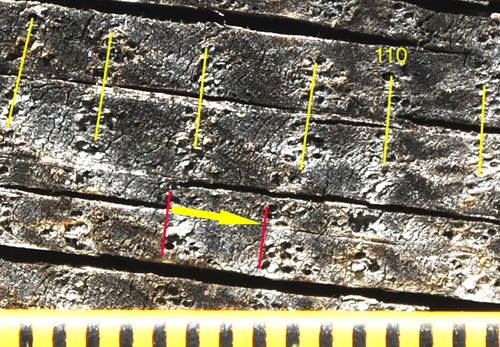
The center of the stump is to the left. The bands with the dark "pits" are the wood that grows in the spring ("spring wood"), while the part between bands of springwood grows in the summer ("summer wood"). The "pits" are actually the openings of the tubes or vascular vessels through which water and sap are moved. See the following section for more details. To count rings, I opened the photo in Photoshop and drew yellow lines through the middle of each spring wood band, adding the count number each 10 rings; each yellow line is the right boundary of the counted ring. To get ring widths I used the Photoshop "measure tool" to measure, in pixels, the width of the springwood plus summerwood that constitute the total of each yearly ring. The width of ring 109 is shown with red lines and the yellow arrow shows the direction of growth and the length corresponding to the ring width.
Level 3 (highest resolution): Photograph the rings, at very close distance with close-up lenses, on the sanded stump or a sanded cut section of the tree using a copy stand, including a ruler in each photo, and then count and measure rings using Photoshop or other image software.
The Entrance White Oak (data in Background) demonstrates this level of resolution. Before photography, the wood was sanded to best show the detail. A section of trunk from the cut tree was available for study in the lab. Initial sanding was done with 36-grit sandpaper glued to a scrap board to ensure a flat surface, followed by hand sanding with grits from 80 to 1500. I used a Nikon SLR camera with a general purpose 18-55mm f/3.5-5.6 zoom lens with 7 diopters of close-up lenses attached, at the closest distance at which it would focus. The camera was in a copy stand to ensure that each photo was taken at the same distance from the wood surface. A mm ruler was taped from center to edge and photos were taken along this guide.
Below is a representative photo. As in level two, white lines were added in the middle of the springwood (the circular openings of the water vessels are very clear) to aid in getting a ring count. Also as in level 2, each annual ring is measured from the start of the springwood to the end of the summerwood. However, with the finely sanded surface and higher magnification, thin brown lines can be seen at the beginning of each springwood (marked with yellow vertical arrows in the photo below). The red arrow shows the width of ring 31 (as before, the center of the tree is to the left).
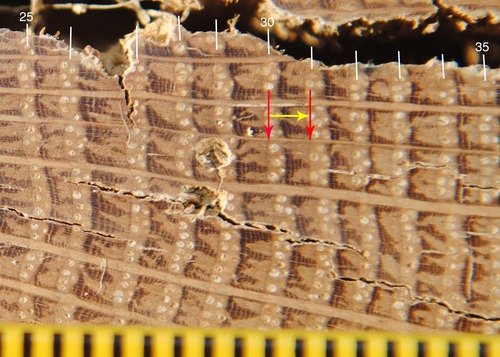
One pixel measured 0.017 mm, which corresponded to 93.0 pixels per mm. This is close to the 0.01 mm level of resolution (100 pixels per mm) often used in research publications.
Conclusions about whether growth history tells us a tree is a Big Grove survivor
Unlike the first two questions, which had simple answers, conclusions about the growth history of these trees must be made cautiously, because a lot more data is needed for the pattern to emerge. But one very intriguing fact is that two of the trees show ecological release at precisely the same year, 1871, which strongly suggests that this was the date at which the Crystal Lake area big timber was cut down. Such an event would allow the small saplings in the understory to grow explosively in the now abundant sunlight. Below is the graph for the Crystal Lake Ash and the Track Bur Oak (the Entrance White Oak has very small rings for all of the years in the record, suggesting that it may always have remained, up to the time it was cut down, in a group of competing trees).
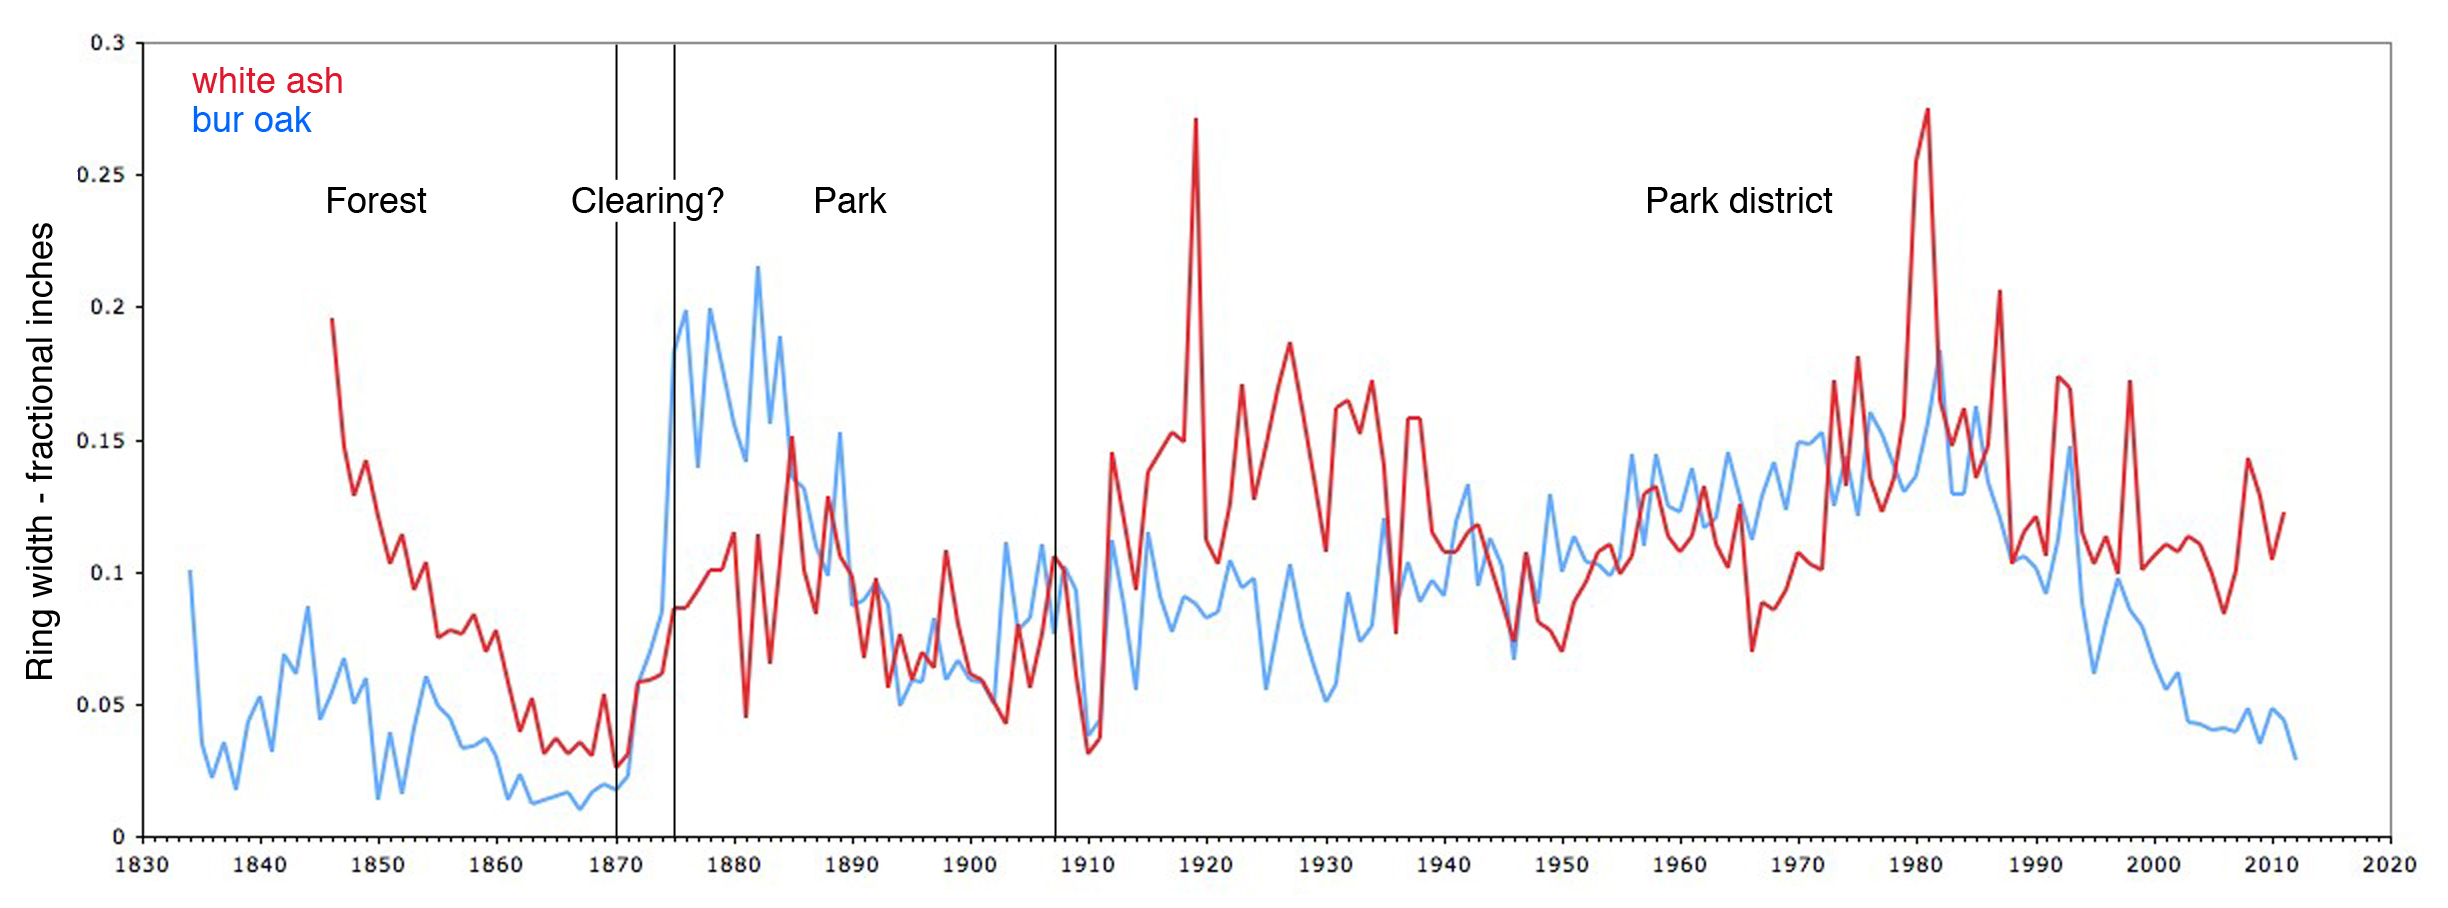
I have divided the time span in the graph into four periods. In the "forest" period, both the ash and oak show a parallel decrease in growth rate (as measured by unstandardized, observed ring width) from 1845 to 1870. This is the growth one would expect in a dark, mature forest. This is followed by the "clearing" just discussed, when from 1870 to 1875 both trees show a sharp increase in growth. Then from the early 1880s to 1907 the area was mostly used as a private park; the growth of the two trees in the "park" period shows a roughly parallel plateau, and then a decrease in growth rate again until 1907. This may indicate that the thinned forest was allowed to regenerate (as suggested by the photo below). Finally, in 1907 much of the Crystal Lake area became incorporated into the Urbana Park District, and more organized maintenance and, presumably, tree planting, began. During this final "Park district" period the trees show no particular similarities but do show a difference: the final 30 years of the Track bur oak's life show a marked decrease in ring widths ( Background ), perhaps because of soil compaction from years of heavy carnival rides and the tromp of county fairgoers feet
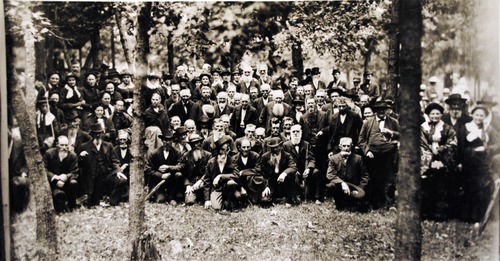
None of the very few available 19th century photographs of the Crystal Lake area show any large trees. The earliest photograph, from my "park" period, is of the 1883 Old Settlers meeting (used with permission from the Urbana Free Library archives), and shows only small trees. Unfortunately the exact location of this photograph in Crystal Lake Park is unknown.
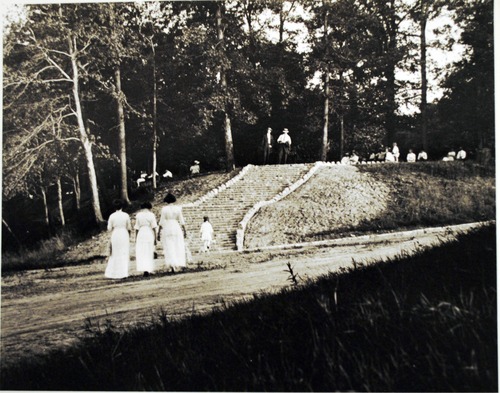
The next photograph (used with permission from the Urbana Free Library archives), from around 1910 (early in my "Park district" period), shows larger trees than the 1883 photo, but still nothing remotely resembling a forest giant. Unlike the previous photograph, this location is clearly identifiable, and is essentially unchanged except that the trees (clearly the same trees) are larger in 2013 than in 1910.
At present there is only one tree (a labeled white oak) in the Crystal Lake Park area that is almost certainly a presettlement tree (but see Conclusions). Overall, the growth data support the idea that many of the trees of the present day Crystal Lake Park area originated in the early settlement era, when they would all have been progeny of presettlement Big Grove trees. The evidence for release due to thinning is particularly compelling and consistent with the "children of giants" idea.