Rosalynn Lee
Department of Marine Science
University of Georgia
|
How to measure microbial photosynthesis
Rosalynn Lee Department of Marine Science |
Mandy Joye and I make measurements of gross oxygenic photosynthesis using oxygen microelectrodes. That means, we measure how much oxygen is given off by the microbial mat. O2, of course, is the product of water splitting in the photosynthetic electron transport system... the energy liberated is later used for such things as fixing CO2.
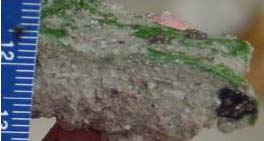 |
A chunk of the microbial mat, harvested from Twin Cays, brought to the lab on Carrie Bow, and incubated for photosynthesis measurements. These mats are also used to study nitrogen fixation and diurnal fluctuations in photosynthetic and N2 fixation capacity. |
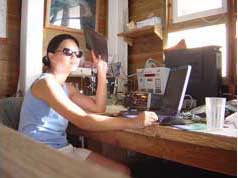
You may have seen us in the corner of the lab at Carrie Bow, backs aching and half awake - slaves to the electrode system. You may have been intimidated by our complaints about the power, or about people bumping into the bench (I’ve given Bill, a student in our lab who has helped us in Belize, plenty of evil glares... see above picture). Under such circumstances, it is to be expected that you haven't asked questions or been given a complete explanation of how we measure rates of photosynthesis, so let me elaborate now.
We use a Unisense system, which includes custom-built microelectrode sensors, a picoammeter connected to an A-to-D converter, and a motorized micromanipulator. Basically, that means we stick very small glass-tipped electrodes down into the mat. The actual measurment involves what is known as a Clark-type oxygen electrode. These use gold, platinum or other metals which react with oxygen and generate a current.
OK, so our Clark-type electrodes have very breakable glass tips, 20-30 um in diameter, with a silicone membrane through which oxygen can diffuse into the electrode. Oxygen is reduced at the gold cathode surface, which is polarized against an internal Ag/AgCl reference anode. The flow of electrons from the anode to the oxygen-reducing cathode produces a current sent to the picoammeter (pico-Amp-meter). This is sort of like a pH electrode, except that we set up a voltage between the two electrodes, and measure the current that flows if oxygen is present.
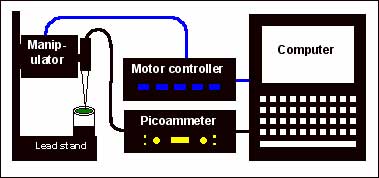 |
Here is a block diagram showing the components of the microelectrode photosynthesis system. Please, don't bump it. Bumps, jumping around or other disturbances shake the electrode. This leads to really wobbly signals, and it doesn't take too much of a shake to break the tip of the electrode. It takes a long time to put a new one on, get it stabilized, and completely restart the measurement sequence! |
As the name flat-out says, this current is very, very small... on the order of 10-12 amps. The picoammeter signal is converted to an amplified, digital signal by the A-to-D converter, so it can be is read by data acquisition software on the computer.
We can record microprofiles (100 um depth intervals) of oxygen concentration through the mat using the Unisense data acquisition software. To measure rates of photosynthesis we use the light-dark shift technique. First, we assume that at steady state (and under constant illumination), the measured concentration of oxygen is a dynamic equilibrium, a function of transport (e.g. diffusion), respiration, and gross photosynthesis. When the light source is switched off, we assume the photosynthesis rate (or at least the rate of water splitting at the "front end") immediately goes to zero, but that transport and respiration are unchanged within the next few seconds. We then calculate the photosynthesis rate from the change in oxygen concentration after the light-dark shift.
| Here is a sample result. On the left, the O2-profile is shown, down through the top 3 cm of the mat. On the right, is a summary of gross oxygenic photosynthesis from light-dark shifts through the same mat. These measurements were made in October, 2001. |  |
In October 2001, we measured oxygen and gross photosynthesis profiles at 200 uE (~10% full sunlight) in the dwarf, transition and fringe zones at the Weather Station. Based on oxygen concentration alone (left panel), the dwarf seems much more productive than the fringe or the transition zone. The photosynthetic rates measured from the light-dark shift method are shown on the right. In the transition zone, rates of photosynthesis are very low and mainly at the surface of the sediment. In the fringe zone, overall chlorophyll concentrations are higher (not shown), but still concentrated at the surface. In the dwarf zone, mat photosynthesis rates are not as high as in the fringe at the surface, but when integrated over the column of photosynthetic activity (up to 2.5 mm), dwarf zone rates are highest.
There is plenty more where that came from (e.g. different light levels, different sites, different seasons…). Stay tuned, and ask questions (carefully).